Advertising
Living Disconnected – Myth or Reality? - Part 2
Posted on Apr 19, 2016
by Andrei Adam & Aidan Lehal
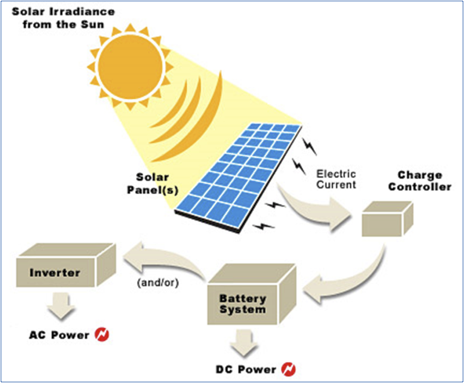
6. Observations
6.1 Electricity Needs
As mentioned before, we used data from one of our houses, which is representative to the average house in the GTA. The electrical consumption of our household was taken from Oakville Hydro’s website, recorded and plotted in order to find trends in the amount of electricity used. Throughout 2015, our household consumed a total of just under 3150 kWh. Below are graphs summarizing the analysis from the electricity consumption data.

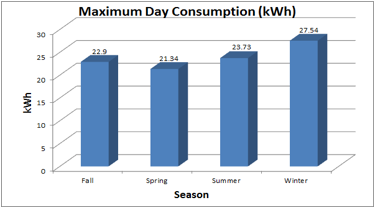
*Defining the seasons: Winter = Dec 1 - Feb 28, Spring = Mar 1 - May 31, Summer = June 1 - Aug 31, Fall = Sept 1 - Nov 30.
The graph above shows us the average daily consumption per season. During the winter, average consumption is the highest, while in the summer average consumption is the lowest. This is necessary to know because this is the minimum amount of electricity the solar panels have to generate in one average day (preferably more so that we have electricity stored in our batteries in case of times when the sun does not shine on the panels). It was also used to size the battery.
The graph below shows the maximum amount of electricity consumed over the course of one day each season. The maximum day consumption was largest in the winter (27.54 kWh consumed) and the smallest in the spring (21.32kWh).
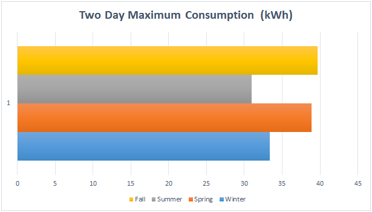
The graph below shows the maximum amount of electricity consumed over the period of two consecutive days in each season in 2015. The reason for this graph is that the battery has to be capable of storing this amount of energy in the case that the solar panels do not produce electricity for two days in a row.
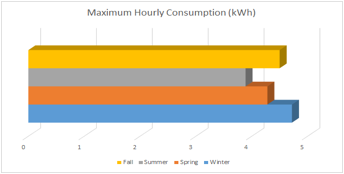
The maximum hourly consumption is necessary for how powerful our inverter has to be. It has to have an inverting capacity of the maximum hourly consumption.
6.2 Sunlight Received Seasonally
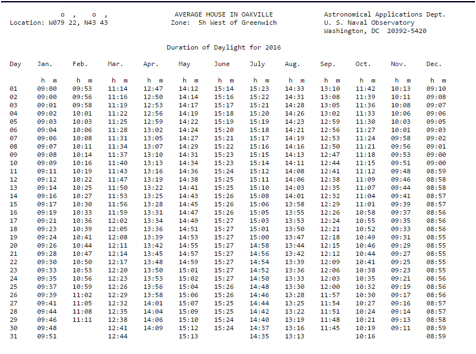
Day hours in Oakville
Measurable Sunlight in Various Major Cities in Canada
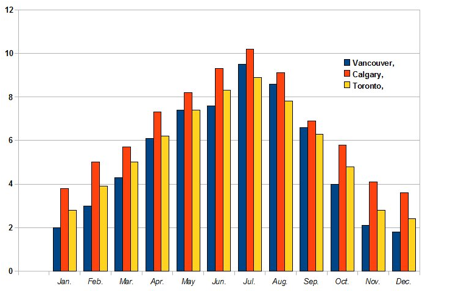
The two figures above show the daylight hours in Oakville and the amount of measurable sunlight in the GTA (when the sun is not obstructed). Around 44% of the time when there is measurable sunlight, the sun is shining the brightest. This is when the solar panels could produce at 100% of their maximum capacity, provided they have the right orientation. For the other 56% of the time, the solar panels could produce at around 60% of their maximum output due to the sunlight hitting the panels at an indirect angle and at a lower intensity.
When there is not measurable sunlight but it is still daytime, the solar panels could produce around 10% of their maximum output ( it is either cloud, snowing, foggy, etc.). When at night, solar panels produce on average at an efficiency of about 1:71 of their maximum output (or about 0.015%), which is negligible.
Using all the information above, we can find out how many hours a solar panel would produce electricity at the four output levels; 0%, 10%, 60% and 100%. The graphs below represent this data seasonally.
Winter (Dec - Feb)

Average 1.33 hours at 100% output a day
Average 1.7 hours at 60% output a day
Average 6.47 hours of 10% output a day
Average 14.5 hours of 0.015% output a day
We can conclude that a solar panel would produce on average the equivalent of 3.01 hours at 100% output during the winter.
Spring (Mar - May)
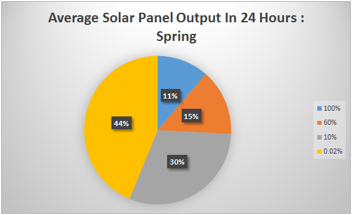
Average 2.73 hours at 100% output a day
Average 3.47 hours at 60% output a day
Average 7.3 hours at 10% output a day
Average 10.5 hours at 0.015% output a day
In the spring, the solar panel would produce on average the equivalent of 5.56 hours at 100% output.
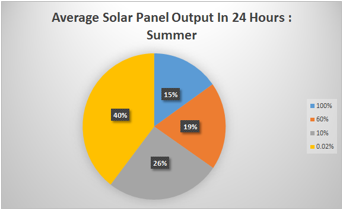 Summer (Jun - Aug)
Average 3.65 hours at 100% output a day
Average 4.65 hours at 60% output a day
Average 6.2 hours at 10% output a day
Average 9.5 hours at 0.015% output a day
We can conclude that a solar panel would produce on average the equivalent of 9.5 hours at 100% output during the summer.
Fall (Sep – Nov)
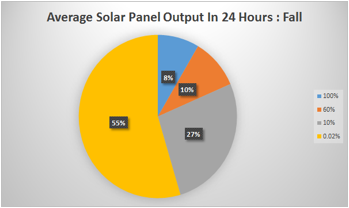
Average 2.02 hours at 100% output a day
Average 2.38 hours at 60% output a day
Average 6.4 hours at 10% output a day
Average 13 hours at 0.015% output
During a day in the fall the solar panel will produce the equivalent of 4.11 hours at 100% output.

6.3 Solar Panel Selection
We selected the solar panels based on various criteria. We first looked at the highest rated panels by professionals in the field and then we looked to which produce the highest amount of electricity in the least amount of space (highest efficiency). The following four solar panels were the ones we considered would be most useful to help us disconnect from the electrical grid.
Panel Parameters
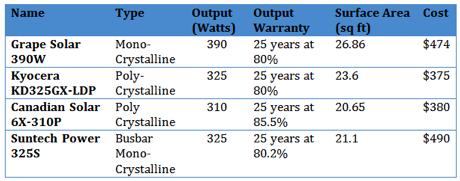
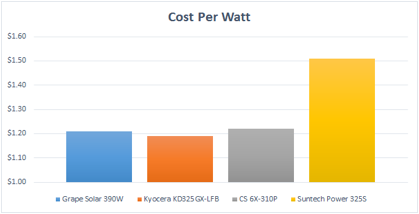
Suntech Power 325S produces the electricity at the highest price ($1.51per watt), while the other three solar panels all produce the electricity between $1.19 and $1.22 per watt.
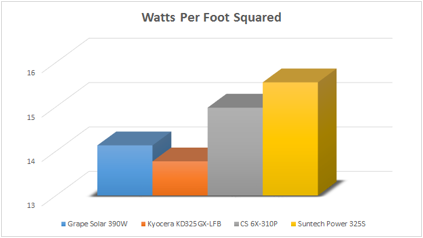
Suntech Power produces the most watts of electricity on one foot squared of space (15.55 watts), while Canadian Solar’s 6X-310P solar panel is not far behind producing just under 15 watts. Kyocera and Grape Solar’s panels trail behind producing 13.77 and 14.3 watts a square foot respectively.
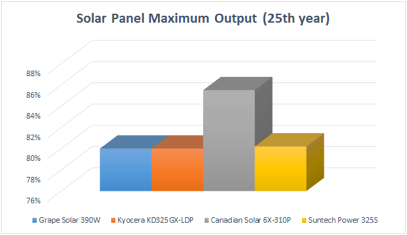
The Canadian Solar 6X-310 maintains the highest output through 25 years of operations. It has almost 5% more efficiency in its 25th year of operation than the second best panel in this category. The two panels which maintain the lowest output through 25 years are Grape Solar 390W and Kycocera KD325 at 80%.
Solar Panel Selection
We have compared all four solar panels and based on the data above we chose to base our further calculations on the use of Canadian Solar 6X-310P.
The 6X-310P has the best cost-per-watt to watt-per-square-foot ratio. In addition it has the least output loss over the course of 25 years, as it operates at 85.5% efficiency in the 25th year, while the second best operates at 80.2% efficiency in the 25th year.
6.4 Roof Space Available For Solar Panels
Roof Area
To find out how many solar panels can be installed on the roof of our house, we calculated the amount of usable surface area on which we can install solar panels. For this, we used the actual roof size dimensions from our house and calculated the roof surface area using those numbers.
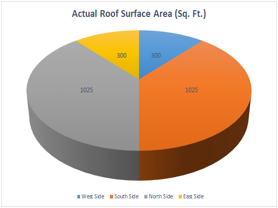
West Side: Triangle with a SA of 300 sq ft(40 x 15 / 2 ft)
South Side: Trapezoid with a SA of 1025 sq ft (50 x 20.5 ft)
East Side: Triangle with a SA of 300 sq ft (40 x 15 / 2 ft)
North Side: Trapezoid with a SA of 1025 sq ft (50 x 20.5 ft)
Total Roof Area: 2650 sq ft
Of the 2650 square feet, approximately 20% square feet in all directions are in such a position that for the majority of the day they are receiving shade making it inefficient to put solar panels on them.
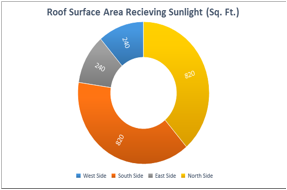
West Side: 300 x 20% = 240 sq ft
South Side: 1025 x 20% = 820 sq ft
East Side: 300 x 20% = 240 sq ft
North Side: 1025 x 20% = 820 sq ft
Total Non-Shaded Area: 2240 sq ft
Given that Canadian Solar 6X-310P panel is 1 x 2 meters, we assumed that about 35% of the roof area is too small to fit an entire solar panel.
Therefore, the space on which we can fit whole solar panels on is 2240 x 35% = 1456 sq ft.
Maximum Solar Panels to Fit On Home and Cost
Usable space on roof= 1456 sq ft
Solar panels 20.7 sq ft
Solar panels installed on roof (rounded down) = 1456 / 20.67= 70
System size = 310 x 70 = 21 700 Watts (21.7 kW)
Cost for panels = 70 x 380 = $ 26 600
6.5 Solar Panel Production
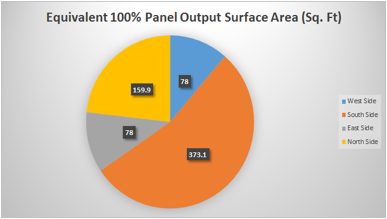
Now even though we have 1456 square feet of solar panels, the production of solar panels depends on the orientation of the roof. For example, the south side produces 70% of the maximum possible output, the west and east side produces 50%, while the north side produces only about 30% of the solar panels maximum output. This is because on all sides the angle at which the sun strikes the solar panels will not be perfect, nor will the sun shine on every side for the entirety of the day. Therefore, the panels on each side of the roof will produce the equivalent energy of the following panels that would produce at 100% capacity.
*Note ESA = Equivalent surface area
West Side: 240 x 35% x 50% = ESA of 78 sq ft
South Side: 820 x 35% x 70% = ESA of 373.1 sq ft
East Side: 240 x 35% x 50% = ESA of 78 sq ft
North Side: 820 x 35 x 30% = ESA of 159.9 ft sq ft
The total 100% ESA is 689 sq ft.
Electricity Produced
Even though throughout its lifecycle the efficiency drops, the selected solar panels will still be able to provide consistent energy through years of service.
Based on the equivalent panel surface area which produces us 100% we can figure out the production of the solar panels.
Equivalent 100% panels on roof (rounded down)= 689 / 20.6 = 33 equivalent panels
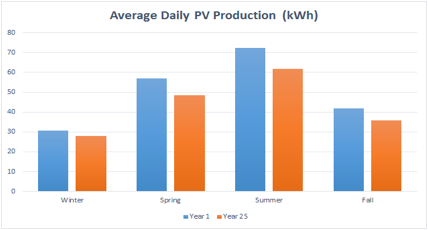
Year 1 Solar Panel Production
Average production (# of solar panels x output x hours of 100% sunlight):
Winter: 33 x 310 x 3.01 = 30 792.3 Watts = 30.8 kWh / day
Spring: 33 x 310 x 5.56 = 56 878.8 Watts = 56.9 kWh / day
Summer: 33 x 310 x 7.07 = 72 326.1 Watts = 72.3 kWh/day
Fall: 33 x 310 x 4.11 = 42 045.3 watts = 42 kWh / day
Year 25 Solar Panel Production:
Yearly, the solar panels lose a small percentage of their maximum production. However, the Canadian Solar guarantees us that their solar panels will produce at 85.5% efficiency in its 25th year. Knowing this, we can calculate the daily production in the 25th year.
Production (# of solar panels x output x hours of 100% sunlight):
Winter: 33 x 310 x 3.01 x 85.5%= 28 025.96 Watts = 28 kWh / day
Spring: 33 x 310 x 5.56 x 85.5% = 48 631.37 Watts =48.6 kWh / day
Summer: 33 x 310 x 7.07 x 85.5% = 61 838.82 = 61.8 kWh/day
Fall: 33 x 310 x 4.11 x 85.5%= 35 948.73 watts = 35.9 kWh / day
6.6 Battery Selection
When looking for the best batteries, we looked for ones that could store sufficient electricity to power our house for the two-day maximum amount consumed. Similar to the solar panels, we found the top batteries based on cost, lifespan and efficiency, among others, to compare them to each other.
Batteries Considered
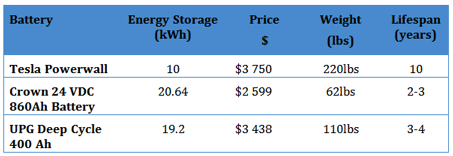
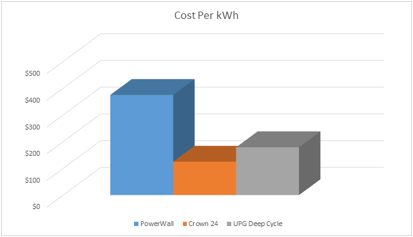
The Tesla Powerwall has the highest cost per kWh ($375); however, this is made up by the fact that the life expectancy is very long.
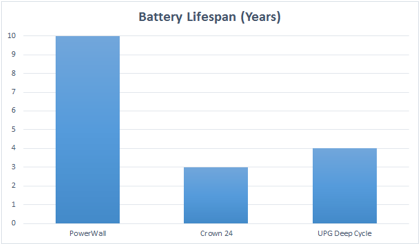
The Tesla Powerwall has over triple the lifespan of the Crown 24 and double of the UPG Deep Cycle, meaning that you have to replace the battery less frequently. This is the big factor, less replacements = less payment over time.
 For our PV system we selected to use 4 x 10 kWh Tesla Powerwall batteries which come to a total price of $20 496. Together they will provide our system with 40 kWh of storage which is sufficient to power our home for four average days, or a day with maximum consume plus a day and a half of average consumption, or our two day maximum consumption without any power generation from the solar panels.
The reason why the Tesla battery was selected over the competition was due to its long 10-year battery life and very high DC round trip efficiency. When bought directly from Tesla we also receive a 10 year warranty and very high vendor credibility.
6.7 Inverter
 When looking for the right inverter for our home, we had to find our maximum consumption in an hour throughout the year. This was because the converting capacity of the inverter needs to be able to supply that power.
For 2015, the maximum we consumed in an hour was 4.72 kW, so we had to look for an inverter with around a 5 kW inverting capacity (DC to AC). We searched through various manufactures and we found an inverter that did our task at a relatively low price with very good reviews.
For this reason we selected the SMA Sunny Boy 5000 Inverter which has a 5 kW inverter capacity (with surcharge capabilities) at a modest cost of $3255. The inverter also has a 10-15 year lifecycle. The efficiency of the Sunny Boy is almost 100%, meaning that very little electricity will be lost.
6.8 Backup Generator

In the unlikely event that the solar panels are not producing electricity and the battery has run out of power, we are going to need something that will continue to power our house until the solar panels start generating power again. This is where the backup generator comes in. We did our research and similar to the inverter found one that really fits our needs. That is the 3 kW Surge Master generator which comes to a total cost of around $999 running on natural gas.
6.9 Installation Costs
The installation costs plus racking for a PV system has gotten to the point where for every 1 watt of capacity, $0.97 is required for installation/racking. Our system has a 21 700 watt capacity which translates into a total installation/racking cost of $21 049.
6.10 Costs and Investment Return
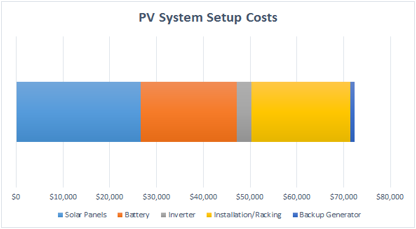
Set Up Costs
Solar Panels (CS 6X-310P): $26 600
Battery (Tesla Powerwall): $20 497
Inverter (SMA Sunny Boy 5000): $3255
Backup Generator (Surge Master 3 kW): $999
Installation/Racking : $21 049
Total Set-Up Cost: $72 400

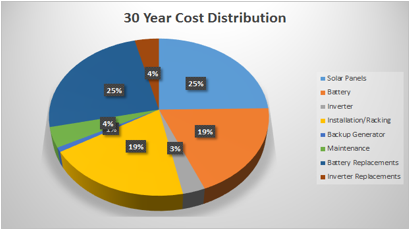
30 Year Costs
Maintenance: Around $150 a year
Battery Replacement: $16 000 in 12 and $10 500 in 24 years ( The cost of batteries will be halved or more in 20 years)
Inverter Replacement: $2600 in 12 and $1600 24 years (The projected cost of inverters is set to go down)
Projected Total Cost over 30 years : $107 600
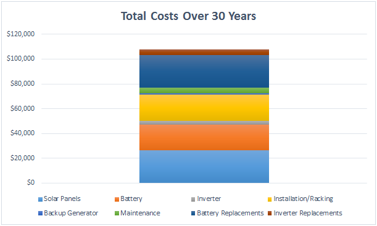
The total costs over 30 years amount to just under $110 000 for the PV system for all the necessary parts and maintenance. The battery and its replacements, solar panels and the installation/racking make up the majority of the costs.
Savings

The above graph shows the electrical bill for our household from Jan 16, 2015 through Jan 15, 2016. Bi-monthly we paid over $100 for our electricity, costs which would be saved in an off-grid solar system.
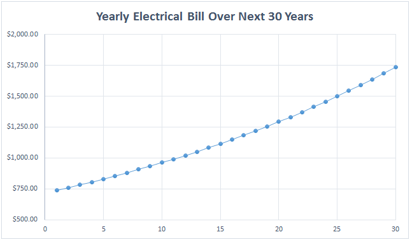
With electrical prices continuing to rise (in 2015 alone they rose by almost 10%), we can predict how much we will have to pay in the future. With a conservative 3% yearly compound increase on electrical prices over the course of the next 30 years we could be paying over double than what we are. This amounts to $9 441 in electrical bill savings over the course of the next 10 years, $21 138 over the next 20 years and $36 858.47 in 30 years.
Property Value Increase
The U.S. National Renewable Energy Laboratory did a study on how much the retail value of homes goes up with the installation of a PV system. What they found was that for every kW installed the value of the home went up by $5 911. Since we have a 22.6 kW PV system installed, the value of our home would rise by $133 588. That is, if we were to sell our home right after installing the PV system. As time goes on and the system deteriorates, the added value to our home decreases. We assumed that each year the added value of our home would decrease by 3%. Of course, if you were to sell your house, you would not get the added benefits of not paying an electrical bill.
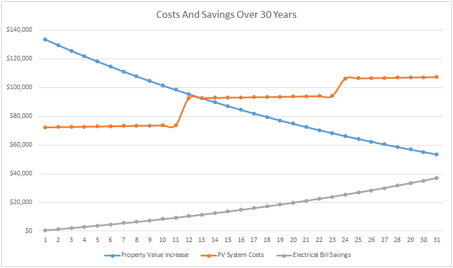
From the graph above we can see that the savings on the electrical bill alone do not amount to the costs of the PV system; however, with the added property value increase, the installation of a PV system might be a smart investment! It all depends if we are willing to sell our home, and if we are, when we do it.
Is it Worth It? You decide!
Total Costs Over 30 Years: $107 450
Electrical Bill Savings Over 30 Years: $36 858.47
Property Value Increase: $113 588 (decreasing 3% annually to $53 569.73).
7. Conclusion
In the end, our hypothesis was mostly accepted, yes, we found out that solar panels installed on our roof would produce sufficient energy to live with the same electrical consumption as we have now off the grid. However, the costs of doing so only are paid back in full if you sell your home with the added retail value of the solar panels. Nevertheless, the fact that our electricity can be produced cleanly and renewably, helping lower our environmental footprint, is, while not financially quantified in this this report, a huge difference between being on and off the grid.
Based on our roof size and positioning, the solar panels produce enough electricity in a day to power our home for 3 to 10 average days, depending on the season. If the day were to be cloudy, the electricity stored in the battery from the days where production was higher than consumed would provide enough electricity to our house for another 4 average days, or two days when we are consuming electricity at the higher rate, which is more than enough time for the solar panels to start producing electricity again. If the storage runs out before the PV panels start producing electricity (an unlikely scenario), then our 3kW backup generator would provide enough power to us for a couple more days. Because of these factors and backups, we can confidently say that we can go off-grid and live with the same electrical usage and lifestyle we have now, without risking going powerless.
All this production and environmental friendliness does amount to costs however, as the cost of setting up and maintaining the off grid system is triple that of the projected electrical bill savings over the course of the next 30 years. The only way to make a return on your investment would be if we sell our house at the increased value brought by the off grid system. By doing so, the maintenance costs would fall on the next homeowner, however, you would not get the savings from the electrical bill. Therefore, our hypothesis is not fully supported, because it is possible to get money back on your investment, just not in the way which we predicted.
Whatever financial path you do chose, the greatest aspect of producing your own electricity through solar panels is that you are taking an aggressive stance on pollution and global warming, and zeroing emission costs for your electricity.
8. Discussion and Applications
What our study shows is that it is possible to produce our own electricity through solar panels, without harming the environment by being connected to the electrical grid. Even though we researched if this was possible on our house, with a few tweaks to some variables our study can not only be expanded to every household in the GTA, but also to every house on earth. To generalize every house in the GTA would have made our project vague and inconclusive. Instead, by focusing on a small sample, our house, we were not only able to come to concrete conclusions for if it is possible to be done on our home, but we also laid down the process to conduct our study to any household around the world.
Due to the fact that our home and electrical consumption are about average, any homeowner in the GTA can look at our study and right away have a sense of what is possible. However, that homeowner does not only have to stop there. Because of the way we conducted our study, the homeowner can input their own roof size, positioning, electrical consumption and electrical bill into our calculations, and receive new results now specified to their household. Everybody now has the power to see for themselves what solar panels can do for their home.
It does not end there. Anyone from around the world can take our study and simply just change the variables to be tailored for their specific house. Simply by changing the amount of sunlight their household receives (all a homeowner needs to know is the daylight hours and hours with measurable sunlight that their region receives), roof size, positioning and their electrical consume and bill anyone on earth can find out the capabilities at which solar panels can operate for them. Our study is truly global, and we believe that when people take it and use it to their full potential, our project can have a global impact.
Now, not only can our project be used to find if it is feasible to power any home around the world cleanly through solar panels instead of being connected to the electrical grid, the observations which we found can be the basis for other studies which can expand on what we did. Due to the fact that our observations found out that once the battery is full, we waste all other electricity produced, another study can be initiated to see if a grid-tied system would be better than an off-grid system as then all extra electricity could be sold to the grid. This would help homeowners know what system they should invest in as they both offer advantages (for example the grid-tied system would help off-set some of the costs by selling the extra electricity). With our project researchers can see what areas of the PV system have to improve so that going off-grid with solar panels is even more beneficial to the homeowner. High cost items such as battery, solar panels and installation are obvious areas of cost and efficiency improvements that industry could focus on.
In conclusion, we believe that we have achieved something great with our study which can have global implications. With slight expansion on the variables anyone can find out if their household can go off-grid and what they will get in return, which we hope will convince many to take the leap and invest in renewable solar energy. From the observations we found, new studies can be conducted to expand on our theories to enlarge our project. Lastly, developers can see what they still have to improve on to reach the point where every household can disconnect and produce their electricity cleanly through solar panels while being cost effective.
We believe that what we have done supports the case that clean energy is the future, and we hope that our study convinces people to join the renewable revolution.